Elliptical Fourier Analysis - EFA Form & Worksheet

GRAPHIC RESULT OF PARTIAL EFA ANALYSIS FOR A SINGLE Gomphonema OUTLINE.


Plots of outlines are color-coded to match the columns on the EFA worksheet from which their data are derived:


yellow - original outline (cols B & C)

blue - smoothed & sampled outline (cols D & E)
green - reproduced outline, k harmonics (cols F & G)
maroon - reproduced outline, k-1 harmonics (cols H & I)

The 4 Orientation Landmarks are also located on the chart:

Landmark 1 - dark blue circle
Landmark 2 - light blue circle
Landmark 3 - orange triangle
Landmark 4 - orange circle


  PREVIEW mode options (left and top right of form)   EFA ANALYSIS mode options (center and lower right of form)
Valve Selection
Centering
Rotation (~apical axis)
Transapical Axis
Reflection (axis)
Trace Origin Normalization
Smoothing Coordinates
Sampling Coordinates
Size Invariance
PREVIEW
  Number of Harmonics
  Invariance (EFA)
  Analysis
  EXECUTE
  EFA Results
  Progress
Help
Chart axis scale control
Goodness-of-fit: reproduced vs. original outlines. (on worksheet)
Refresh Menu (on worksheet)


PREVIEW OPTIONS

Options in the Preview section are effected when the Preview button is clicked.


Valve Selection Frame

Enter valve number to select a valve for preview or analysis. Frame indicates the valve number selected out of the entire set of valves, e.g., Valve 5 of 16, on the OrigOutline worksheet.
The number must be an integer in the range of 1 to the maximum number of valves in the data set. The default is 1.

Centering Frame

Outlines are translated (centered) such that their "centers" coincide with the coordinate system's origin, i.e., x= 0 , y = 0. THE DEFAULT is Option Centroid.

Option Centroid uses the centroid of the original outline to define the center.
Option Landmarks uses the midpoint of the x-coordinates of Orientation Landmarks 1 and 2.
Option Custom uses a customized procedure and requires a code be entered for the procedure in the text box adjacent to the option.
Option None results in no centering; however, this option is not recommended as the EFA chart is constrained to having its scale maximally +/- 100 on both the x-axis and the y-axis, and thus the outlines will not neccesarily fall within the domain of the chart.

Rotation (~apical axis) Frame

Outlines are rotated about their "center" based on an axis so that the axis has a slope of zero and thus coincides with the x-axis. The DEFAULT is Option Principal Axis.

Option Principal Axis defines the valve's long (apical) axis as the first principal axis of all original outline coordinates.
Option Landmarks defines the valve's long (apical) axis as a straight line between Orientation Landmarks 1 and 2.
Option Custom uses a customized procedure and requires a code be entered for the procedure in the text box adjacent to the option.

Option None effects no rotation.


Transapical Axis Frame

The position of the transapical axis is based on either Landmark 4 (its perpendicular projection onto the apical axis) or a midpoint on the apical axis. The transapical axis is used for reflection of the outline, should it be desired, such as reversing the display of the head and tail poles in a Gomphonema. The DEFAULT is Midpoint.

Option Midpoint uses the centroid of all original outline coordinates to place the transapical axis.
Option Landmarks uses Orientation Landmark 4 to place the transapical axis.
Option Custom uses a customized procedure and requires a code be entered for the procedure in the text box adjacent to the option.
Option None results in no transapical axis being defined.


Reflection Frame

The outline is reflected about either the transapical axis or apical axis or both. DEFAULT is reflection about both axes, such that Orientation Landmark 1 is to the left (on the negative x-axis) and Orientation Landmark 3 is above the x-axis (on the positive y-axis).
A checked box effects the reflection; an unchecked box disables it.
The axes used will be those defined in the Rotation (~apical axis) Frame and the Transapical Axis Frame. Selecting Option None is those frames disables the reflection

Trace Origin Normalization Frame

All traces are forced to proceed clockwise, regardless of how they were generated and how the outline may have been reflected in processing. Trace origins may preserve that of the original digitization (Option None), or be reset to coincide the intersection of the outline with the positive x-axis (Option x-axis) or be reset to originate at a specific landmark. Landmark-defined origins require a customized procedure and code; Option Custom).

Smoothing Coordinates Frame

The entire set of original outline coordinates is smoothed by either an average or median filter. The window size is set in the textbox for both options. The DEFAULT option is NONE.

Option Average effects a smoothing using the mean of a "window" of >= 3 and <= 31 coordinates; the window size must be an odd integer.
Option Median effects a smoothing using the median of a "window" of >= 3 and <= 31 coordinates; the window size must be an odd integer.
The DEFAULT window size for both smoothers is "3".

Sampling Coordinates Frame

Sampling evenly spaces all the points in the outline and may reduces their number to a smaller set of evenly spaced points. The DEFAULT is to evenly space all the points if their number is <= 1000, and if there are > 1000 points to reduce them to 200 equally spaced points.

Option original: The choice of "original coordinates" is allowed only if the number of outline coordinates is <= 200. In this case the 200 original coordinates are not resampled and their spacing is not changed; the analysis proceeds using the original raw coordinates.
Option "evenly spaced coodinates": This samples the original outline to produce an evenly spaced set of points. Enter the number of evenly spaced coordinates to be sampled from the outline for analysis.
Sampling occurs from the smoothed outline, if there is one; otherwise, it occurs from the original unsmoothed outline. This reduces the number of outline points.
The sampling default is 200 or the maximum number of points in the outline, if it is less than 200. Minimum sample size is 10, maximum is 1000. Sample sizes exceeding the maximum number of points in the outline are not permitted. The maximum number of points in the outline is indicated in the Sampling Frame.


Size Invariance Frame


The DEFAULT is None.

Size normalization based on length uses the user-defined length, if it is available, the distance between Orientation Landmarks 1 and 2. Otherwise this option uses the length of the outline along the first principal axis (determined using all coordinates).
Size normalization based on area uses the square root of the valve face surface area as estimated by Eves' (1972) method for two-dimensional polygons.
If size normalization in the EFA is to be based on the area estimated using the Fourier coefficients of the best fitting ellipse, choose "None" here, and choose "ellipse semimajor axis" in the Invariance (EFA) frame on the right side of the EFA form


PREVIEW Button

  Clicking here performs the reorientation, smoothing, sampling, refection and size normalization procedures chosen and then plots the resulting subset of outline coordinates (blue markers) on top of the original coordinates (yellow markers) in the chart on the EFA worksheet. This subset of coordinates will be the subject of the EFA, when it is executed. The coordinates of this subset are in columns D & E on the worksheet under "Final Outline".

Reorientation, selecting, smoothing, sampling and varying the size sormalization methods may be previewed repeatedly to examine the effects of different combinations of these processes on different valves.

EFA ANALYSIS OPTIONS

Number of Harmonics Frame

    Enter the number of harmonics to be used to the describe the outline.
The number of harmonics must be an integer in the range 1 to 30. The default is 20.

On each side of the box indicating the number of harmonics is a button, one with a "+" sign and the other "-" sign. These buttons EXECUTE the EFA after increasing (+) or decreasing (-) the number of harmonics-to-be-extracted by 1, respectively.

Invariance (EFA) Frame


Centering is based on the centroid, rotation and size on "the [slope and] magnitude of the semimajor axis of the best-fitting ellipse, that is, the first order Fourier coefficients corrected to the trace starting point" (Rohlf & Archie 1984). The trace starting point is normalized as the intersection of the positive x-axis and the outline.

The scale of specimens for which size has been normalized by the above will generally be different from that of the original and smoothed-and sampled outlines, and so when plotted together these outlines will not "superimpose". One of the major reasons for drafting this program was to provide a visual means of interpreting the effects of different harmonics on the characterization of the outlines. To do this, leave the size box in this section unchecked and examine the results of the EFA while you explore what different harmonics do. When you are ready to export results of the EFA to the worksheets, that is, actually store the data, check the size box is you wish size invariance for the specimens. This will effect the scale of the results, not the effects of the harmonics.


Analysis Frame & EXECUTE Button


Option Selected 
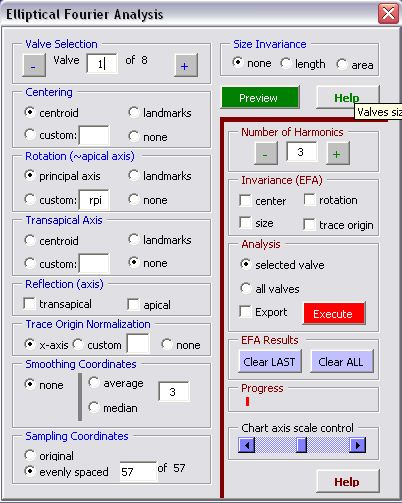
valve specifices an EFA be conducted on a single selected valve (see Select Valve Frame) which displays the Fourier coefficients and the harmonic 
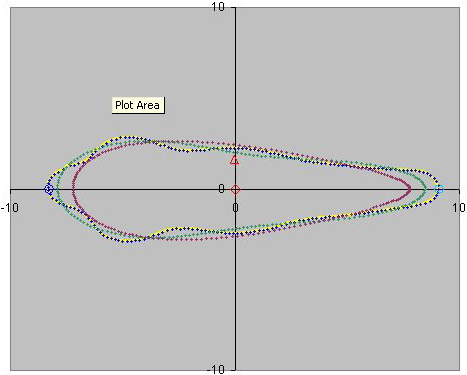
amplitudes on the EFA worksheet and then plots the reproduced outlines 
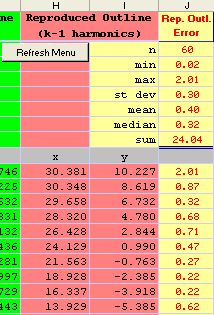
using k [worksheet columns F & G] and k-1 [worksheet columns H & I] harmonics [k is the number of harmonics used in the analysis ("Number of harmonics" frame above)] along with the original and smoothed-and-sampled outlines. The colors of the chart points correspond to colored columns on the EFA worksheet holding the respective outline coordinates.

Option All valves specifies EFAs on all valves in the data set on the ImportOutline worksheet. No graphic output occurs during this processing, except for updating of the Progress Bar, unless the Export box is checked. No tabulated output occurs to the EFA worksheet, except for coordinate columns B to I.

Selecting Export causes the EFA results of either a single valve or all valves to be written to two worksheets. Data exported to the EFAResults worksheet include basic valve identification and descriptive information, processing modes, Fourier coefficients and harmonic amplitudes. Data exported to the EllipDescr worksheet are basic valve identification and descriptive information, processing modes and the elliptical descriptors of Schmittbuhl et al. (2003).

The EXECUTE Button executes the EFA using the smoothing, sampling, normalization and number of harmonics chosen for either a "Selected valve" or "All valves."

Reproduced outlines are not stored but are generated independently.


EFA Results Frame


The CLEAR LAST button deletes information of the last valve processed from both EFAResults and EllipDescr worksheets. CLEAR LAST produces a complete, single-row deletion of all data from the last row on these worksheets. The button can be used repetitively to delete a series of "last" valves.

The CLEAR ALL button deletes all outline information on the EFAResults and EllipDescr worksheets. If you choose this option, a message will inquire if you are sure that you want to do this. You might want to copy these data to a new worksheet before deletion.


Progress Bar

    When calculations are expected to take more than a few seconds, this progress indicator is activated. This will usually occur when Median Filters are selected for smoothing or when option All Valves is selected and outlines are processed as a batch in the EFA.

Help Buttons

Clicking displays abbreviated versions of this Help page. The green Help button accesses the Preview sections, the red Help button the EFA execution sections.

Chart Axis Size Control

The scroll bar at the bottom right of the EFA form controls the upper and lower limits of the axes of the chart of the valve outlines. Both abscissa and ordinate are constrained to have the same upper and lower limits. The axes in this Chart should ONLY be modified using this scroll bar.

Goodness-of-fit: reproduced vs. original outlines

For ever analysis the absolute linear distance ("error") between members of each pair of coordinates in the reproduced (k harmonics) and the smoothed-and sampled outline is recorded in column J on the EFA worksheet. Cells J3:J9 provide a summary of the statistical descriptors of the distribution of these "errors" . These provide a quantitative measure of the differences between the outlines seen on the chart.

Refresh Menu

On occasion the CDiatom item in the Main Menu diappears. Usually this is a result of the cursor focus being on an embedded chart. Selecting anything other than the chart will usually restore CDiatom. But not always, for reasons I am unable to fathom, so I have provided a Refresh Menu button which will do so.

Updated 1 July 2009 RKE


.