|
ReproOutl
Worksheet & Reproduced Outlines Form
 Before
each set of selected outlines is reproduced, all outline information on
the ReproOutline worksheet is cleared in the first 50 columns, i.e., columns
A to AX. So, reproduced outlines cannot be stored in this section of the
worksheet. However, they can be copied to either columns beyond column
AX on this worksheet or to a new worksheet using standard Excel copy and
paste tools. Do not, however, rename this "ReproOutl" worksheet. Before
each set of selected outlines is reproduced, all outline information on
the ReproOutline worksheet is cleared in the first 50 columns, i.e., columns
A to AX. So, reproduced outlines cannot be stored in this section of the
worksheet. However, they can be copied to either columns beyond column
AX on this worksheet or to a new worksheet using standard Excel copy and
paste tools. Do not, however, rename this "ReproOutl" worksheet.
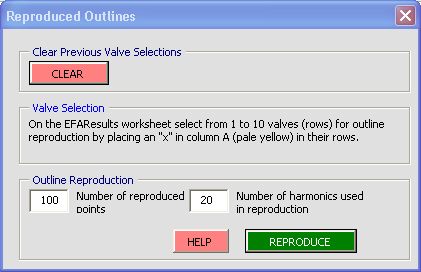 In
the Outline Reproduction Frame on the Reproduced Outlines Form, set the
number of points to be included in the reproduced outlines from
20 to 400. This number will apply to all outlines reproduced and is not
constrained by the number of points in the original or smoothed-and-sampled
outline. In
the Outline Reproduction Frame on the Reproduced Outlines Form, set the
number of points to be included in the reproduced outlines from
20 to 400. This number will apply to all outlines reproduced and is not
constrained by the number of points in the original or smoothed-and-sampled
outline.
In the Outline Reproduction Frame, set the number of harmonics
to be used in reproducing the outline. If fewer than the number of harmonics
entered here are available for an outline, then that outline is reproduced
with the maximum number of harmonics available. For example, if 10 harmonics
were extracted for a valve, but you have set the number of harmonics for
reproduction at 20, then it will be reproduced with 10, which is the maximum
for that valve.
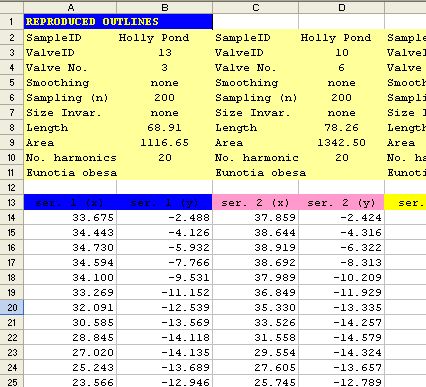
The reproduced valve outlines in the embedded chart are color-coded to
match the colors in row 13 on the ReproOutl worksheet (see chart of top
of this page). Mousing over an outline point will also generate a tool-tip
indicating the columns on the worksheet from which the data are derived.
Click on Reproduce
on the Outline Reproduction Frame to reproduce the selected
outlines. T
The
embedded chart on the ReproOutl worksheet (top of this
page) displays a maximum of 25 reproduced outlines, that is, those
for outlines in columns A to AX. This is not a special chart, so the user
is free to alter it using standard Excel tools; it is simply linked to
the first 50 columns on the worksheet. You are free to extend the range
of columns included in the chart beyond AX. Should this chart be deleted,
simply create a new one, or create several. The programs provides the
data for making the graphs but leaves the graphs up to the users and their
creativity with Excel. There is no automatic scale adjustment in these
graphs; this adjustment is left up to the user, but keep it square of
you will distort your outlines.
|
 The
outlines of valves which have been subjected to EFA can be reproduced
using their Fourier coefficients. Outline reproduction involves two worksheets:
The
outlines of valves which have been subjected to EFA can be reproduced
using their Fourier coefficients. Outline reproduction involves two worksheets: