LEFT
(e.g., A)
RIGHT
(e.g., B)
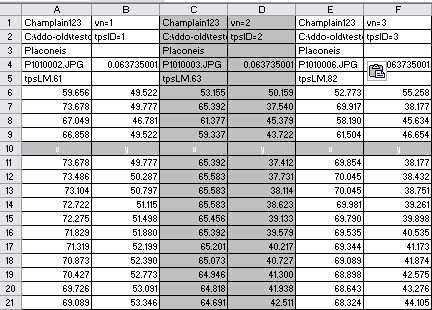
1
2
3
4
5
6
(x-coordinate)
Orientation Landmark
1
(y-coordinate)
7
(x-coordinate)
(y-coordinate)
8
(x-coordinate)
(y-coordinate)
9
(x-coordinate)
(y-coordinate)
10
This
grayed row serves as a header for the beginning of outline coordinates
in row 11 and holds only "x" and "y" labels for the
coordinates in their respective columns.
11-
Outline
coordinates begin in row 11, the x-coordinate in the left column, the
y-coordinate in the right column, and proceed down the worksheet. Rows
11-7511 in all columns on the worksheet are reserved for outline coordinates.
None of the above descriptors is necessary to run the program as long as there are coordinate data in rows 11 on down; however, the user will be find it difficult to interpret the results without at least some of them. Minimally, valve (specimen) ID numbers will be assigned by the CartesianDiatom-EFA program (cells B1, D1, F1, ...).
In the absence of an entry for a scaling factor (row 4), the program will default to using the value "1".
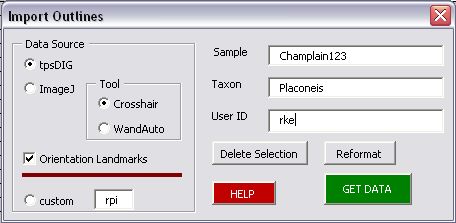 In
the Data Source Frame on the Import Outlines Form select one of the 3
option buttons or enter the data
manually onto the worksheet:
In
the Data Source Frame on the Import Outlines Form select one of the 3
option buttons or enter the data
manually onto the worksheet: